The events of August once again underscored the importance of using a diverse set of indicators that account for various uncorrelated risks.
In just a few days, the VIX surged sharply, reaching over 60 during intraday trading, albeit outside regular market hours. This marked the third highest level in history and the highest since the Covid-19 crisis in March 2020. The media has attributed this spike to several factors, including the yen carry trade, a weak jobs report stoking recession fears, and overcrowded dispersion and short volatility trades.
We won’t delve into these narratives further, as you’re likely already familiar with them. To summarize, the short volatility strategies — whether through the yen carry trade, dispersion trading, or option writing (all these approaches are kind of short-vol as they are betting that no surprise will happen and things will stay unchanged) — were overcrowded. In such a scenario, it only takes a spark to ignite a chain reaction.
Given this context, it’s an opportune moment to review how our Long/Short strategy, available as ETP+ (AQLS), performed during this period.
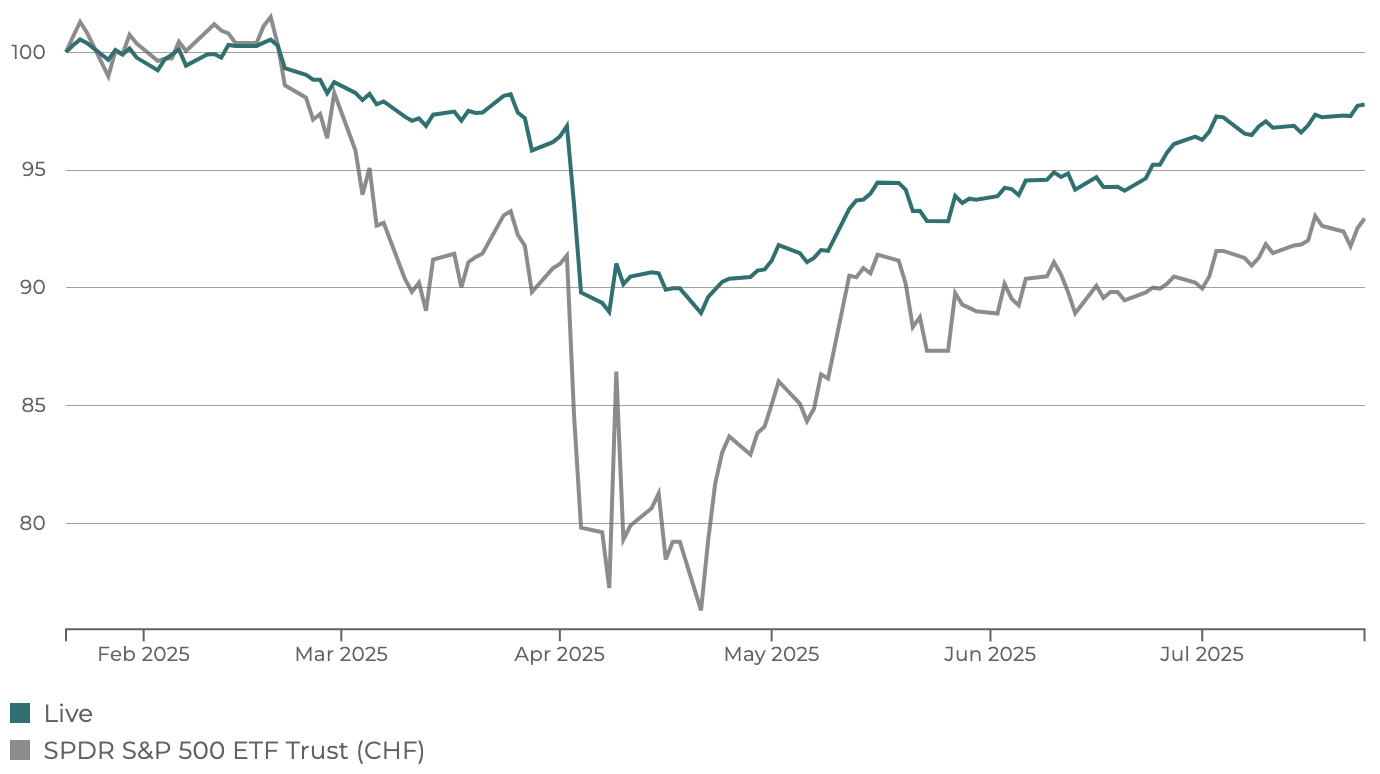
Specifically, the Leonteq Alquant Long-Short US Equity ETP+ (AQLS) demonstrated resilience amidst the nearly 10% decline in equity markets. By July 22, the ETP had already reduced its equity exposure, guided by its reactive risk indicators, as illustrated in the following graph.

Visually, it's evident that by July 22, the risk indicators had anticipated a spike in volatility that caught most investors by surprise. This foresight allows us to evaluate the ETP's performance against two benchmarks: the S&P 500 TR index and the CBOE S&P 500 5% Put Protection Index (PPUT). While the PPUT employs a different strategy, utilizing unconditional protection through the purchase of one-month 5%-OTM put options, comparing it with AQLS provides valuable insights into the effectiveness of hedging strategies during this period. It's important to note that AQLS only trades futures on the S&P 500 TR index, with exposure ranging from +100% to -50%.

The PPUT index's protective puts mitigated the drawdown's severity but also hindered the rebound, preventing the PPUT index from outperforming the S&P 500 TR over the analyzed period. In contrast, AQLS's dynamic exposure management enabled a proactive approach, significantly reducing the drawdown while capitalizing on the rebound by increasing exposure once the major risk had subsided. AQLS's risk management enabled it to anticipate the drawdown and the rebound, taking it to a new all-time high.
If we now take stock of the two drawdowns suffered by the S&P 500 TR index since the launch of AQLS at the beginning of 2024, we can see that this ETP+ has succeeded in attenuating their amplitude.

It's noteworthy that the OTM puts offered little value during these two events. On the other hand, AQLS’s dynamic exposure management successfully reduced drawdowns in both instances. While this cannot guarantee similar outcomes in future drawdowns, it demonstrates AQLS's ability to react to and anticipate sudden trend changes and unprecedented spikes in volatility within days, supporting the argument for AQLS’s robustness.

This content is advertising material. This content as well as all information displayed on any of Alquant’s websites does not constitute investment advice or recommendation, and shall not be construed as a solicitation or an offer for sale or purchase of any products, to effect any transactions or to conclude any legal act of any kind whatsoever. Past performance is not a guide to future performance.

Alquant, a Swiss Fintech and quantitative asset manager, is transforming asset management with innovative solutions. Leveraging deep financial and technological expertise, we offer a range of services including investment products, quantitative research, and software solutions, empowering financial institutions to create the financial products of the future.
© 2018-2024 Alquant SA. All Rights Reserved.


.svg)